
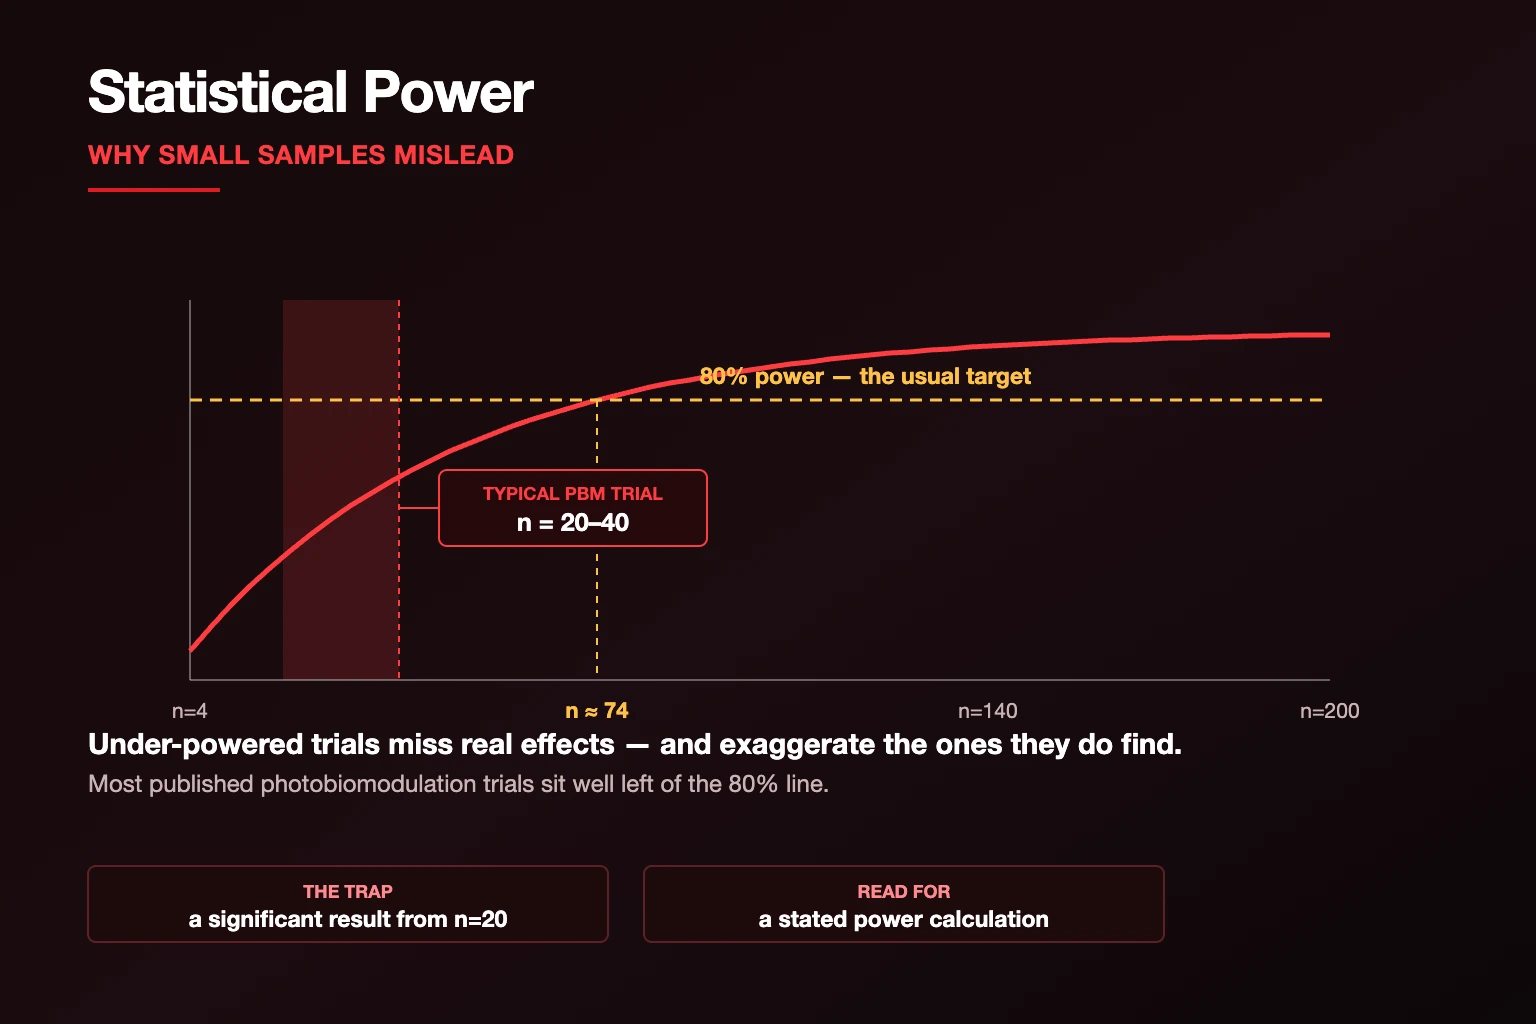
A photobiomodulation study can be randomized, blinded, and carefully dosed yet still produce an unreliable answer if it includes too few participants. Small trials often generate wide uncertainty, miss real but modest effects, and occasionally publish dramatic estimates that shrink when larger studies are conducted.
Photobiomodulation statistical power is the probability that a study’s analysis will detect an effect of a specified size when that effect truly exists. Power depends on more than the head count. It also depends on outcome variability, the expected effect, allocation ratio, study design, significance threshold, missing data, and the planned statistical model.
This guide explains what statistical power means, why small PBM samples deserve caution, how sample-size calculations can go wrong, and what readers should look for beyond a “statistically significant” label.
Research note: This article concerns study design and interpretation. It does not determine whether photobiomodulation is appropriate for a particular person or condition.
What photobiomodulation statistical power measures
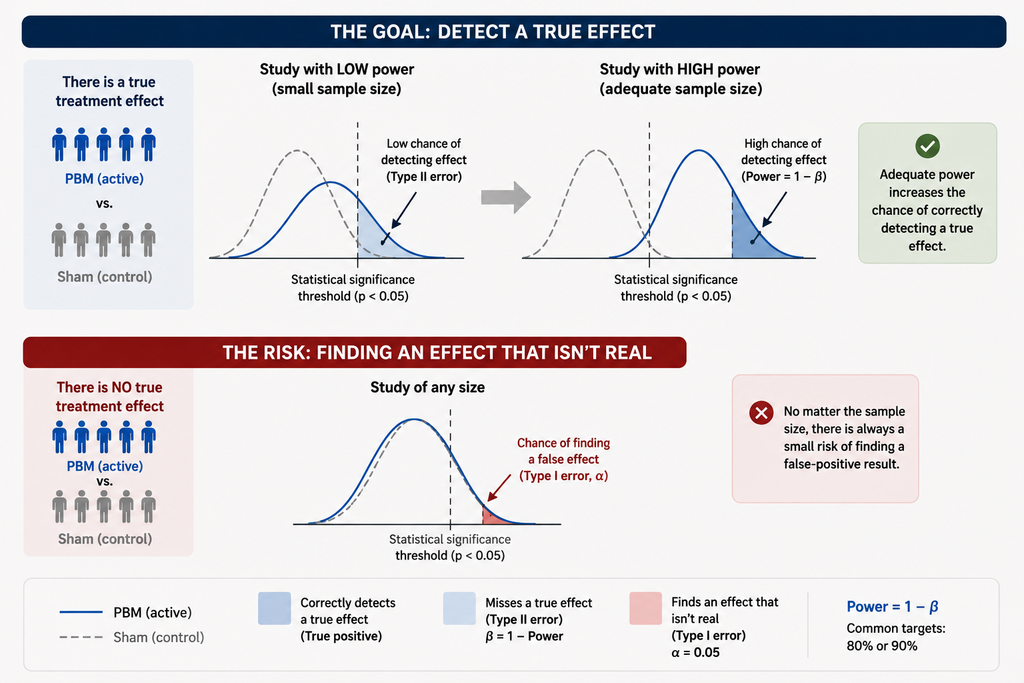
Suppose a well-conducted trial compares active photobiomodulation with a credible sham. If the active protocol truly improves the prespecified primary outcome by the amount investigators consider important, statistical power describes the chance that the planned analysis will identify that difference under the assumptions used in the calculation.
Many clinical studies target 80% or 90% power. An 80% target means that, if the assumed effect and all other assumptions are correct, repeated trials of that design would produce a statistically detectable primary result about 80% of the time. It does not mean the completed study has an 80% chance of being correct, and it does not mean 80% of participants will benefit.
The corresponding missed-detection probability is the Type II error rate, often called beta. Power equals one minus beta.
Sample size is only one ingredient
A conventional sample-size calculation usually requires several inputs:
- Primary outcome: the single main endpoint the trial is designed around.
- Target difference: the smallest effect investigators want reliable power to detect.
- Variability: the expected standard deviation or event rate.
- Significance level: commonly a two-sided alpha of 0.05.
- Desired power: often 80% or 90%.
- Design features: allocation ratio, repeated measurements, clustering, crossover correlation, or covariate adjustment.
- Expected attrition: the percentage likely to withdraw or lack usable outcome data.
A larger target effect requires fewer participants to detect. Greater variability requires more. More stringent error control, additional treatment groups, unequal allocation, and anticipated dropout also tend to increase the required enrollment.
Why PBM trials can be especially variable
Photobiomodulation outcomes may vary because participants differ in diagnosis, baseline severity, skin and tissue characteristics, medications, activity, sleep, and adherence. The intervention itself adds more dimensions: wavelength, optical power, irradiance, radiant exposure, beam area, pulse settings, distance, contact, treatment location, session timing, and number of sessions.
If positioning or output is inconsistent, participants nominally assigned to the same protocol may receive different exposures. Measurement error adds noise and makes a true group difference harder to detect. Tight equipment calibration and standardized delivery are therefore statistical issues as well as technical ones.
Heterogeneous enrollment can also increase variability. A broad population may improve generalizability, but it usually requires enough participants to estimate the average effect and explore genuine differences without relying on tiny subgroups.
Small studies often miss real effects
The most direct consequence of inadequate power is a false negative: the data do not provide strong evidence against the null hypothesis even though the tested intervention has an effect. That does not mean every nonsignificant small trial is secretly positive. It means the result may be too imprecise to separate a worthwhile effect from no effect or even harm.
A statement such as “PBM had no effect” is usually too strong when the confidence interval is wide. A more accurate interpretation may be “the trial did not detect a difference, and its estimate remains compatible with both benefit and little or no effect.”
This distinction is important. Absence of statistically significant evidence is not automatically evidence of absence.
Why significant results from small samples can also mislead
Low power is usually introduced as a false-negative problem, but published positive findings from underpowered studies deserve caution too. If the true effect is modest, a small experiment will reach a conventional significance threshold mainly when random variation makes the observed difference look unusually large.
This selection process can inflate the effect estimate among the studies that become “positive.” It is sometimes called the winner’s curse. The nominal Type I error rate does not automatically rise just because a correctly analyzed study is small, but the combination of low power, many tested outcomes, flexible analyses, and preferential publication of positive results reduces the proportion of published significant findings that represent stable effects.
A large estimate from a tiny study is therefore not proof of an unusually powerful treatment. It may be genuine, exaggerated, or a chance result. The width of its confidence interval and independent replication matter.
Statistical significance is not clinical importance
A p-value addresses how unusual the observed data would be under a statistical model, including a null hypothesis. It does not measure the probability that the hypothesis is true, the size of the benefit, or whether the difference matters to patients.
A large trial can detect a very small difference that has little practical value. A small trial can estimate a potentially important difference but remain too imprecise to pass a significance threshold. Readers should examine the effect in the outcome’s natural units, compare it with a clinically meaningful threshold when one is established, and consider the confidence interval.
For example, a one-point change on a pain scale has a different meaning from a one-point change on a mobility questionnaire. Standardized effect sizes can help compare different scales, but they can be hard to translate into lived benefit.
Confidence intervals reveal what the sample can support
A confidence interval gives a range of effect values compatible with the data and model at a stated confidence level. Smaller studies generally produce wider intervals. Wide intervals warn that the estimate is unstable even when the p-value falls below 0.05.
Consider a hypothetical result showing a two-point average pain reduction with a 95% confidence interval from 0.1 to 3.9 points. The estimate favors PBM, but the interval includes a trivial effect and a much larger effect. The study has not pinned down the magnitude.
Now consider an estimated reduction of 0.2 points with an interval from -1.5 to 1.9. Calling that “no effect” ignores the fact that appreciable benefit and harm both remain compatible with the data. A precise interval near zero would support a stronger conclusion of little meaningful effect.
The expected effect size can make a calculation optimistic
Investigators often estimate the target difference and variability from earlier studies. If those studies were small or selectively published, their reported effects may be exaggerated and their variability estimates unstable. Designing a new trial around an optimistic effect can produce a sample that is too small.
A defensible calculation should prioritize the smallest clinically important difference, supported by clinical reasoning or validated thresholds, rather than simply copying the largest prior result. Sensitivity calculations can show how the required enrollment changes under more conservative assumptions.
Protocols should report the assumed difference, standard deviation or control event rate, alpha, power, test, allocation ratio, and dropout allowance. Saying only that “G*Power was used” is insufficient.
Attrition reduces effective sample size
A trial may enroll the planned number but analyze fewer participants because of withdrawal, missed visits, device nonadherence, unusable measurements, or exclusion after randomization. If attrition was underestimated, effective power falls.
Missing data can also bias the result when the reason for missingness relates to treatment or outcome. For example, participants who find sessions uncomfortable or ineffective may be more likely to stop. Simply analyzing completers can destroy the balance created by randomization.
Readers should compare planned enrollment, randomized participants, primary-analysis participants, and available data at each time point. The analysis should explain its approach to missing outcomes and ideally include sensitivity analyses.
Multiple outcomes and repeated testing complicate power
PBM studies commonly measure several outcomes and time points. Testing each comparison at alpha 0.05 without a prespecified hierarchy increases the chance that at least one result appears significant by chance. Correcting for multiple comparisons protects against false positives but can reduce power, which may require a larger sample.
Repeated measurements can improve efficiency because each participant provides more information, especially when observations are strongly correlated. But the gain depends on the analysis and correlation assumptions. Treating repeated observations as independent can produce incorrect standard errors.
The sample-size method should match the planned primary analysis. A calculation for a simple two-group t-test may not be appropriate when the primary model includes repeated measures, multiple centers, clusters, or several treatment arms.
Crossover and split-body designs are not shortcuts without tradeoffs
In a crossover trial, participants receive active and control treatments in different periods. In split-body studies, different body sites receive different conditions. Because each participant serves partly as their own control, these designs can achieve useful precision with fewer people when within-person correlation is high.
They also add assumptions. Treatment effects must not carry over improperly between periods or sites. Washout must be adequate, sequence effects considered, and the analysis must account for pairing. Light delivered to one region could potentially influence outcomes measured elsewhere, depending on the scientific question.
A small participant count may be reasonable for an efficient paired design, but the authors must justify the assumptions and use the correct unit of analysis.
Pilot and feasibility studies answer different questions
A pilot may be designed to test recruitment, adherence, sham credibility, device operation, measurement procedures, and variability—not to provide a definitive efficacy verdict. Treating a small feasibility study as a conclusive treatment trial overstates what it was built to do.
Pilot effect estimates are often too unstable to serve as the sole basis for a future sample-size calculation. They can inform logistical parameters and plausible variability, but conservative external evidence and a clinically meaningful target should also guide planning.
Readers should check whether the authors labeled the study as pilot or feasibility work and whether their conclusion stays within that scope.
How a transparent PBM protocol handles sample size
A published protocol for a placebo-controlled PBM trial in chronic nonspecific low-back pain described calculations for its primary pain and disability outcomes, including the target differences and estimated standard deviations. Other PBM protocols have similarly reported alpha, desired power, assumed effect size, and dropout adjustments.
Such reporting allows scrutiny before results are known. It does not guarantee that every assumption is correct, but it gives readers enough information to judge whether the chosen sample was aligned with the primary question.
Prospective registration and a dated statistical analysis plan further reduce the temptation to redefine the primary outcome after an underpowered result.
What systematic reviews should do with small trials
Meta-analysis can combine several small studies and improve precision, but it cannot automatically repair biased designs, incompatible doses, inconsistent outcomes, or selective publication. A narrow pooled confidence interval can still be misleading if the included evidence is systematically distorted.
Reviewers should evaluate risk of bias, heterogeneity, dose and population differences, small-study effects, missing trials, and certainty of evidence. A systematic review of PBM for exercise performance, for example, called for further investigation because of small samples, methodological limitations, and variation in exercise and phototherapy protocols.
Readers should avoid counting how many studies were “positive.” Larger, more precise, better-controlled trials should carry more interpretive weight than a collection of tiny studies with different methods.
A practical checklist for readers
- Was one primary outcome and time point clearly prespecified?
- Was the sample-size calculation published before results were known?
- What target difference and variability were assumed?
- Was the target difference clinically meaningful and reasonably conservative?
- Did the calculation match the actual design and primary analysis?
- Was allowance made for dropout and unusable data?
- Did the trial reach its planned enrollment?
- How many participants contributed to the primary analysis?
- Were treatment groups balanced after attrition?
- Are effect estimates reported with confidence intervals?
- Were multiple outcomes, time points, or subgroups handled transparently?
- Was a pilot study interpreted as exploratory rather than definitive?
- Do independent, adequately powered studies reproduce the finding?

The bottom line
Photobiomodulation statistical power determines how capable a study is of answering its prespecified question under stated assumptions. Small samples are not automatically invalid, and large samples do not cure poor design. The concern is whether the sample, variability, endpoint, model, attrition allowance, and error control fit together.
For readers, the safest approach is to move beyond the p-value. Examine the planned sample-size assumptions, actual enrollment, confidence interval, clinical importance, missing data, multiplisamplcity, and replication. A nonsignificant small trial may be inconclusive rather than negative, while a dramatic positive result from a tiny sample may be much less precise than its headline suggests.
Last reviewed: August 23, 2026.