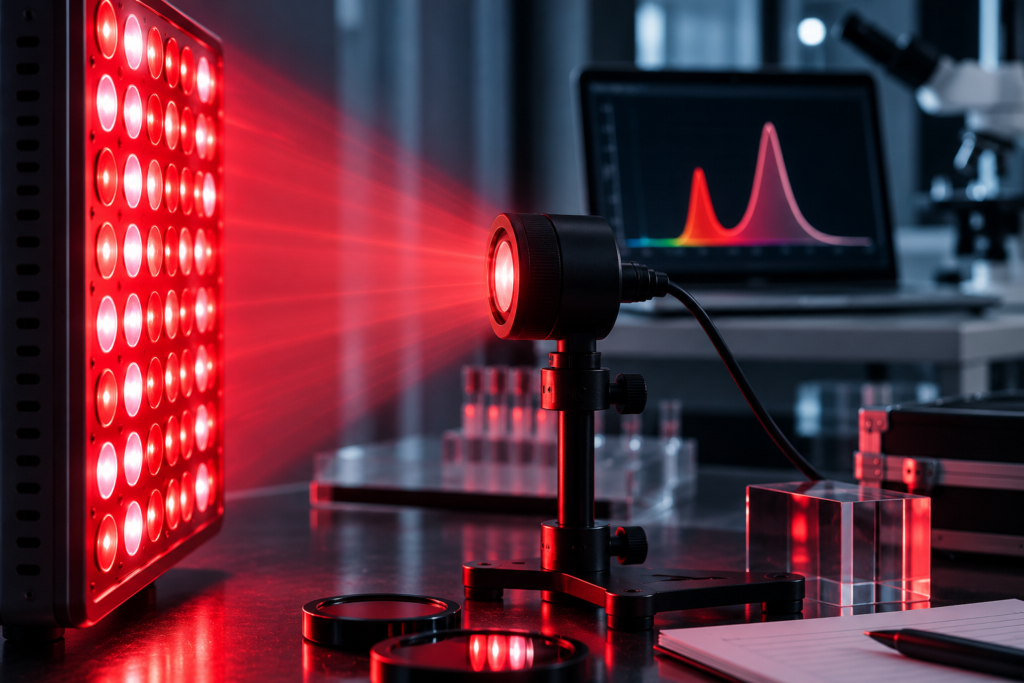
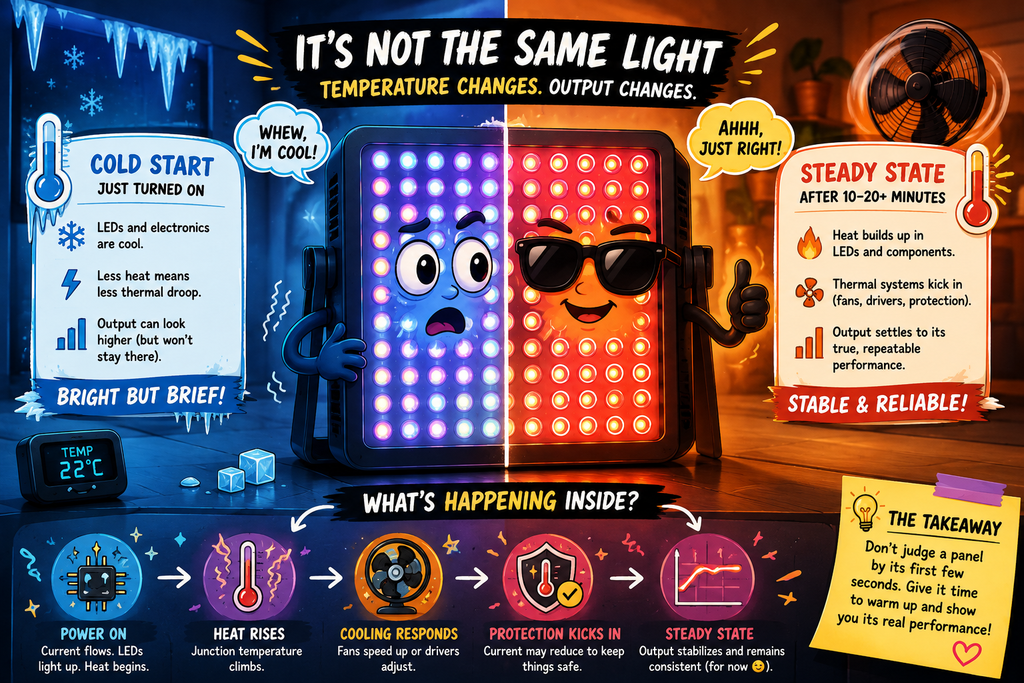
Red light panel warm-up can change sustained output because a red light therapy panel does not necessarily deliver identical output from the first second to the last. LEDs, drivers, power supplies, sensors, and cooling systems change temperature after switch-on. The optical output may settle gradually, decline, rise, or cycle as thermal controls respond.
This is why a panel measured cold can produce a different irradiance result than the same panel measured after ten or twenty minutes. Understanding warm-up behavior helps consumers interpret test reports, troubleshoot inconsistent readings, and compare devices under repeatable conditions.
What “Warm-Up” Means for an LED Panel
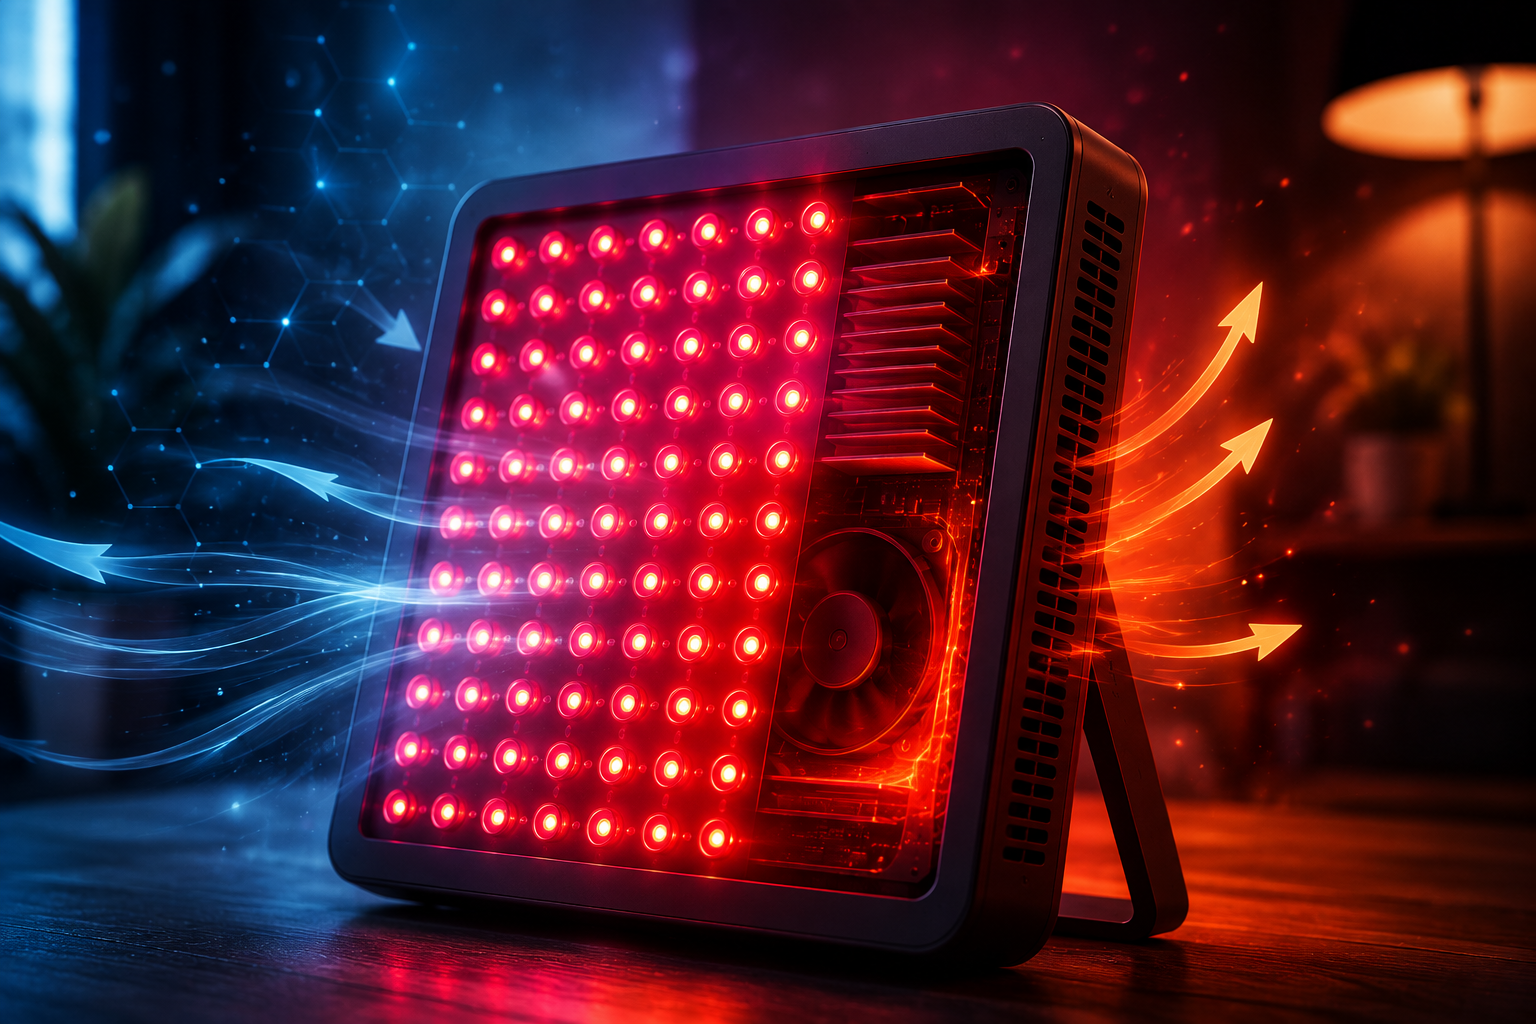
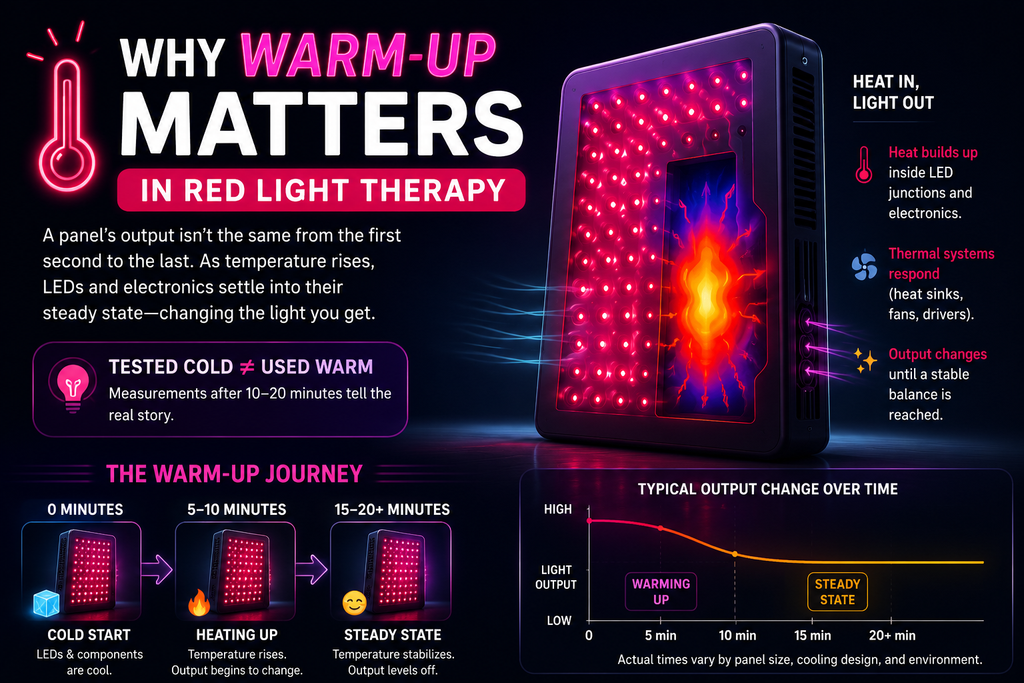
Warm-up is the transition from the device’s initial temperature to a more stable operating state. When current begins flowing, the LED junctions and electronic components generate heat. Heat moves through circuit boards, heat sinks, the enclosure, and surrounding air. Fans may start immediately or change speed as temperature rises.
The exterior can feel only mildly warm while the semiconductor junction is considerably hotter. Junction temperature—not room temperature alone—strongly influences LED electrical and optical characteristics. NIST’s high-power LED work emphasizes that reproducible optical measurements require defined operating temperature.
Why LED Output Can Change as Temperature Rises
LED conversion efficiency is temperature-dependent. As junction temperature increases, nonradiative processes and electrical behavior can reduce emitted optical power. The exact response depends on semiconductor material, wavelength, current, package, and thermal design.
This decline is often called thermal droop. It should not be confused with efficiency droop caused by high current density, although both can occur together. A complete panel adds driver regulation and thermal controls that can either mask or amplify changes at the individual LED level.
Red and near-infrared LED types may not drift identically. Measuring only combined output can hide a channel-specific change.
Cold-Start Output Versus Steady-State Output
A cold-start reading is taken soon after switch-on, before temperatures stabilize. A steady-state reading is taken after the device reaches a defined condition where output changes slowly enough for the measurement goal.
There is no universal five- or ten-minute warm-up that suits every panel. Small passively cooled devices may settle quickly. Large arrays, enclosed systems, and temperature-controlled drivers may take longer. Some systems never become perfectly constant; they reach a repeating thermal cycle.
A test report should show how stability was determined rather than naming an arbitrary interval. For example, it might require successive readings to remain within one percent over five minutes.
Why Pulsed Factory Measurements Can Look Higher
LED component manufacturers often use short electrical pulses during production tests. Pulsing enables fast measurement before the junction warms substantially. NIST notes that this cold pulsed output does not necessarily match steady DC performance in a finished lighting product.
A therapy-device company should not use a component’s brief laboratory output to represent continuous finished-panel performance unless the operating conditions genuinely match. Package data, actual drive current, junction temperature, optics, and enclosure all differ.
Finished-device testing at realistic settings is more useful for consumers than multiplying catalog specifications.
The Role of Heat Sinks and Fans
Heat sinks spread and release thermal energy. Larger surface area, conductive materials, airflow, and good contact between components reduce thermal resistance. Fans move air across internal surfaces and can help maintain a lower, more stable junction temperature.
Fan speed may be fixed or controlled by temperature. A variable system can create a curve: output changes while the panel warms, stabilizes after the fan increases, and may oscillate slightly as the controller cycles.
Fanless operation is not automatically superior. It can reduce noise and mechanical failure points, but it requires enough passive cooling for the installed power. Likewise, a loud fan does not prove strong optical output.
Driver Regulation and Thermal Protection
An LED driver controls current. A well-regulated driver can keep current stable as supply voltage and temperature change. Some devices intentionally reduce current when internal temperature crosses a threshold. This thermal protection can prevent damage but lowers optical output during the hot period.
If a panel starts bright and then drops sharply after several minutes, possible explanations include thermal regulation, power-supply limiting, fan failure, obstructed airflow, or normal LED temperature response. Diagnosing the cause requires optical, electrical, and temperature measurements together.
Spectral Shift During Warm-Up
Temperature can change the LED peak wavelength and spectral shape. The size and direction depend on the semiconductor. A panel may therefore show small spectral changes along with output drift.
For multi-wavelength devices, each band should be evaluated separately. A combined spectrum can conceal movement when peaks overlap or when one channel changes more than another. Our guide to LED spectral width and FWHM explains how peaks and emission bands are reported.
The Meter Also Needs Thermal Stability
Not every drift comes from the panel. Radiometer detectors and electronics can be temperature-sensitive. Moving a meter from a cool room, exposing it to the panel’s radiant heat, or holding it by hand can change its response.
NIST calibration documents account for detector temperature stability as an uncertainty component. In a consumer setup, follow the meter instructions, allow it to acclimate, avoid heating the sensor unnecessarily, and repeat control readings.
A simultaneous reference source can help distinguish meter drift from panel drift in laboratory work.
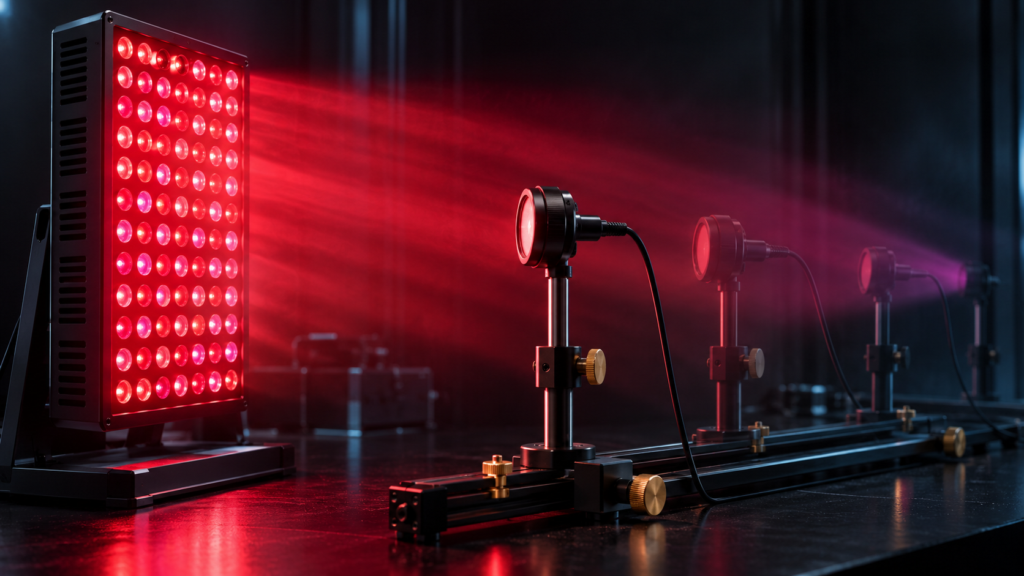
How to Measure Panel Warm-Up Behavior
- Control room conditions. Record ambient temperature and avoid strong drafts or sunlight.
- Start from a defined state. Let the panel cool to room conditions for a consistent period.
- Fix the geometry. Mount the detector at a marked position, distance, and angle.
- Record settings. List active wavelengths, brightness, pulse mode, and fan configuration.
- Begin logging immediately. Capture output at short intervals during the first minutes and longer intervals afterward.
- Measure long enough. Continue through at least a typical session and until the chosen stability criterion is met.
- Record temperatures. Use safe, appropriate methods to monitor air inlet, outlet, enclosure, heat sink, or internal sensors.
- Repeat the test. One run can be affected by room changes or positioning error.
- Test channels separately. Red and near-infrared arrays may have different behavior.
Choosing a Sampling Interval
A reading every second can reveal fast driver or control changes, but many handheld meters update slowly. A practical consumer test might record every 30 seconds for the first five minutes and every minute afterward. Laboratory equipment can log continuously.
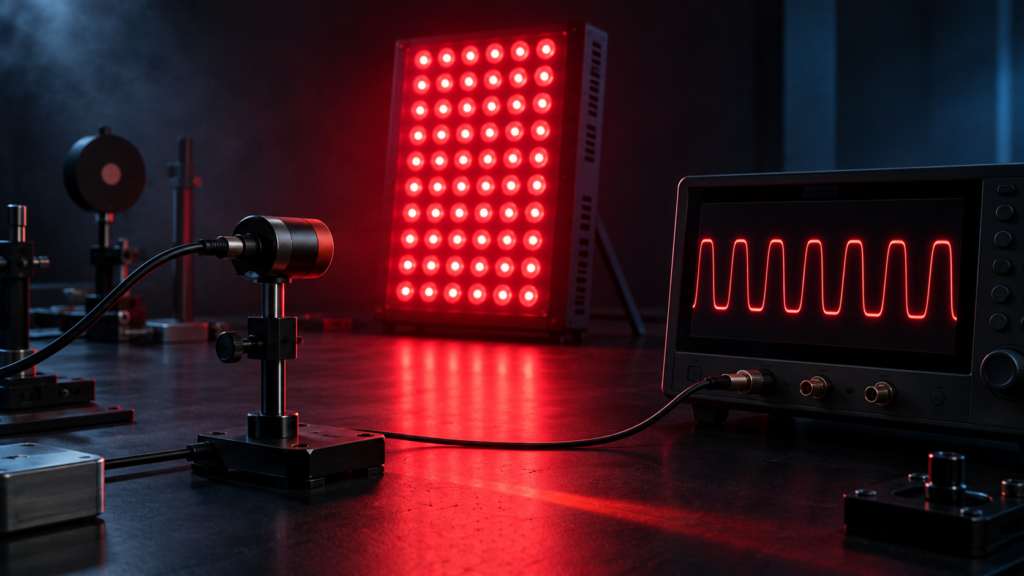
The sampling rate must match the question. Warm-up drift occurs over minutes, while flicker occurs over milliseconds or less. A slow irradiance meter may measure thermal trends but cannot characterize temporal modulation. The panel flicker guide explains that separate measurement.
Peak, Average, and Minimum Output
A warm-up curve should not be reduced to the highest reading. Report cold-start peak, stable average, minimum during the session, percent change, and time to the stability criterion.
For example, a device might start at 105 mW/cm², decline to 96 mW/cm² after twelve minutes, and remain between 95 and 97 thereafter. The useful steady-state description is around 96 mW/cm² under those conditions, not simply “up to 105.”
Uncertainty and repeatability still matter. A two-percent apparent change may be within meter and positioning variation.
Spatial Drift Across a Large Panel
Temperature may not be uniform. LEDs near a power supply, in the center of a dense array, or in a low-airflow region can operate hotter. As a result, the spatial irradiance pattern can change while the panel warms.
A single center detector cannot show this. Repeat a grid map cold and after stabilization when uniformity is important. The beam-angle and coverage guide describes spatial mapping.
Warm-Up Behavior at Different Brightness Levels
Dimming reduces electrical and thermal load, but driver methods vary. Some devices lower current; others use pulse-width modulation. Thermal behavior at 50% may not scale directly from full power.
Test the settings people actually use. A panel can be stable at maximum with fans running continuously yet cycle at a lower setting when temperature control turns the fans on and off.
Warm-Up in Pulsed Modes
Duty cycle affects average electrical and optical power. A 50% pulse mode may generate less heat than continuous operation at the same peak current, but the relationship depends on driver losses, pulse amplitude, frequency, and cooling.
Report both peak and time-averaged irradiance. Do not compare a cold continuous reading with a warmed pulsed average as if they were the same quantity.
Does Output Drift Change Dose?
Yes. Radiant exposure integrates irradiance over time. If output declines gradually, multiplying the cold-start value by the entire session time overestimates surface energy.
For a precise calculation, integrate the measured irradiance curve. A simpler estimate can use a justified time average after sampling the full session. Our irradiance and dosage guide explains the underlying units.
A small engineering difference does not automatically change a biological outcome. The relevance depends on protocol, uncertainty, and dose-response evidence.
Troubleshooting Unusual Output Decline
- Check that air inlets and outlets are unobstructed.
- Listen for fans that fail to start, grind, or cycle abnormally.
- Confirm the correct power supply and input voltage.
- Repeat the test with a fixed meter and controlled room temperature.
- Measure red and near-infrared channels separately.
- Compare full and reduced brightness settings.
- Look for thermal-warning indicators or automatic shutdown.
- Review manufacturer instructions before cleaning vents or servicing.
Stop using a device that smells burnt, shows damaged wiring, becomes unusually hot, repeatedly shuts down, or produces unstable electrical behavior. Contact the manufacturer or a qualified service provider rather than opening energized equipment.
What a Manufacturer Stability Report Should Include
A useful report identifies the device sample, firmware, settings, ambient temperature, sensor, calibration, geometry, sampling interval, wavelength channels, and run duration. It publishes the time series or summary statistics and defines “stable.”
Testing multiple units supports a model-wide claim better than one hand-selected sample. The report should distinguish normal warm-up drift from long-term aging.
Warm-Up Drift Versus LED Aging
Warm-up drift occurs within a session and is mostly reversible after cooling. Aging is a gradual change across many operating hours. Dust, fan wear, thermal-interface degradation, and component drift can affect long-term output.
Maintenance and periodic checks help detect those changes. The existing device cleaning and maintenance guide covers routine care without encouraging unsafe disassembly.
Common Testing Mistakes
- Comparing one panel cold and another warmed.
- Moving the handheld sensor between readings.
- Ignoring room and detector temperature.
- Ending the test before a typical session is complete.
- Using the highest reading as sustained output.
- Combining channels that drift differently.
- Confusing slow thermal drift with high-frequency flicker.
- Assuming any decline proves a defect.
How Warm-Up Fits Into Device Comparison
Stable output makes dose estimation and research reproduction easier, but warm-up performance is only one engineering quality. Compare spectrum, irradiance, uniformity, controls, electrical safety, instructions, build, warranty, and service support.
A transparent company should describe realistic sustained output instead of relying on a cold peak. The device buyer’s guide offers the wider comparison framework.
When a Warm-Up Difference Is Actually Meaningful
A change should be interpreted relative to the combined measurement uncertainty and the repeatability of multiple runs. If the meter, placement, and source each contribute variation, a one- or two-percent shift may not be distinguishable from noise. A larger, repeatable decline that appears at the same time and temperature across runs is stronger evidence of genuine thermal behavior. Product comparisons should use steady-state results gathered with the same method; clinical interpretations require separate dose-response evidence.
Conclusion
Red light therapy panel output can change during warm-up because LED junction temperature, driver regulation, cooling, power-supply behavior, and meter temperature all evolve after switch-on. Cold-start readings may not represent a full session.
Measure from a consistent cooled state, fix the detector geometry, log through the typical operating period, define a stability criterion, and report steady average output alongside the initial peak. Separate wavelengths and settings when possible. These controls turn “it seemed dimmer” into a repeatable technical observation without assuming that every small change is clinically meaningful.