
A red light therapy device described as “660 nm” does not normally emit every photon at exactly 660 nanometers. An LED produces a band of wavelengths clustered around a peak or center. The width and shape of that band are part of the source’s spectral output.
Full width at half maximum, usually abbreviated FWHM, is a common way to summarize that width. Understanding it helps readers interpret spectrometer reports, compare LEDs with lasers, and avoid treating a nominal wavelength as a perfectly precise line.
Why an LED Is Not Exactly One Wavelength
Light-emitting diodes produce photons when charge carriers recombine in a semiconductor. The material composition and device design set the general emission region, but temperature, manufacturing variation, drive conditions, and the distribution of energy states contribute to a spread of wavelengths.
A product can therefore use LEDs sold as 660 nm even though a measured spectrum peaks at 657 nm, 662 nm, or another nearby value. The spectrum also extends on both sides of that peak. A nominal label is useful shorthand, not a complete spectral characterization.
Lasers generally have a narrower spectrum than LEDs, but “laser” does not automatically mean a single mathematical wavelength. In one human photobiomodulation study comparing several lasers with an 810 nm LED, the reported FWHM values were 3–9 nm for the lasers and 20 nm for the LED. Those numbers describe the sources used in that study; they are not universal specifications for all lasers and LEDs.
What FWHM Means
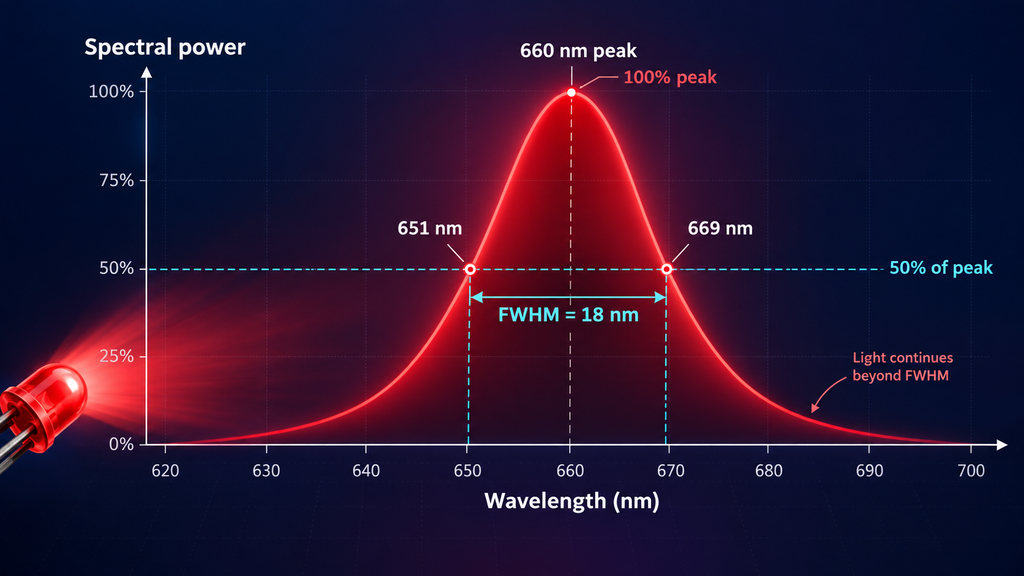
Imagine a graph with wavelength along the horizontal axis and spectral power along the vertical axis. The tallest point is the spectral peak. Find half of that maximum height, then identify the wavelength on each side where the curve crosses that level. The distance between those two wavelengths is the full width at half maximum.
If a spectrum centered near 660 nm crosses half maximum at 651 nm and 669 nm, its FWHM is 18 nm. That does not mean the LED emits only from 651 to 669 nm. Output continues beyond those points at levels below half the peak.
FWHM is useful because it summarizes a peak without requiring every point in the spectrum. It is still only one number. Two sources can have the same peak wavelength and FWHM yet differ in asymmetry, secondary peaks, tails, or total power.
Peak Wavelength, Center Wavelength, and Dominant Wavelength
These terms should not be used interchangeably.
- Peak wavelength is the wavelength where measured spectral power is highest.
- Center wavelength can refer to a defined center of a spectral band. The exact calculation should be stated.
- Centroid wavelength is a power-weighted center across the spectrum.
- Dominant wavelength is a colorimetric concept tied to perceived visible color relative to a reference white. It is not the same as the radiometric peak.
Near-infrared output is outside normal visible perception, so a colorimetric dominant wavelength is not an appropriate substitute for its spectral peak. A serious device report should say what wavelength quantity it presents.
FWHM and Spectral Power Distribution
The full spectrum is called the spectral power distribution, or SPD. It shows how radiant power is allocated across wavelength. A normalized graph sets the peak to a common value such as one or 100%, which makes shape easy to compare but removes absolute power information.
A normalized spectrum cannot tell you irradiance on the skin. For that, the spectral measurement must be connected to calibrated radiometric power under defined geometry. Conversely, a broadband irradiance meter produces a total value but may not show how that energy is divided among wavelengths.
NIST has noted challenges in broadband LED radiometry, including detector spectral response. A meter that responds differently at 630, 660, 810, and 850 nm can bias a combined reading unless the response is corrected.
Why Spectral Width Matters in Photobiomodulation Research
Photobiomodulation studies often identify a source by one wavelength, but a broadband LED delivers energy across a band. A 2025 methodological analysis of visible LED therapy emphasized that LEDs are not monochromatic and that only a portion of total fluence lies within any narrow interval around the quoted center. The authors argued for reporting spectral width and accounting for the distribution when comparing exposures.
This does not mean a broad LED spectrum is ineffective. It means a study is more reproducible when it reports the actual source. Researchers trying to repeat an experiment need the spectrum, irradiance, treatment time, beam area, distance, pulse settings, and schedule—not just “red LED.”
Our guide to reading red light therapy studies explains why matching the population, device parameters, protocol, and outcome matters before applying a result.
Does a Wider FWHM Mean More Wavelengths Are “Working”?
A wider spectrum covers a larger wavelength range, but that does not establish a stronger or broader biological effect. Optical absorption and biological response are not binary switches at one number. Evidence for one device and protocol cannot be expanded to every wavelength inside its emission tail without data.
It is equally inaccurate to assume that all energy outside the nominal peak is wasted. The spectrum may overlap a broader biological action region, but the relevant response depends on tissue, dose, depth, and the scientific question. Spectral overlap is a physical fact; clinical effectiveness requires separate evidence.
Temperature Can Shift an LED Spectrum
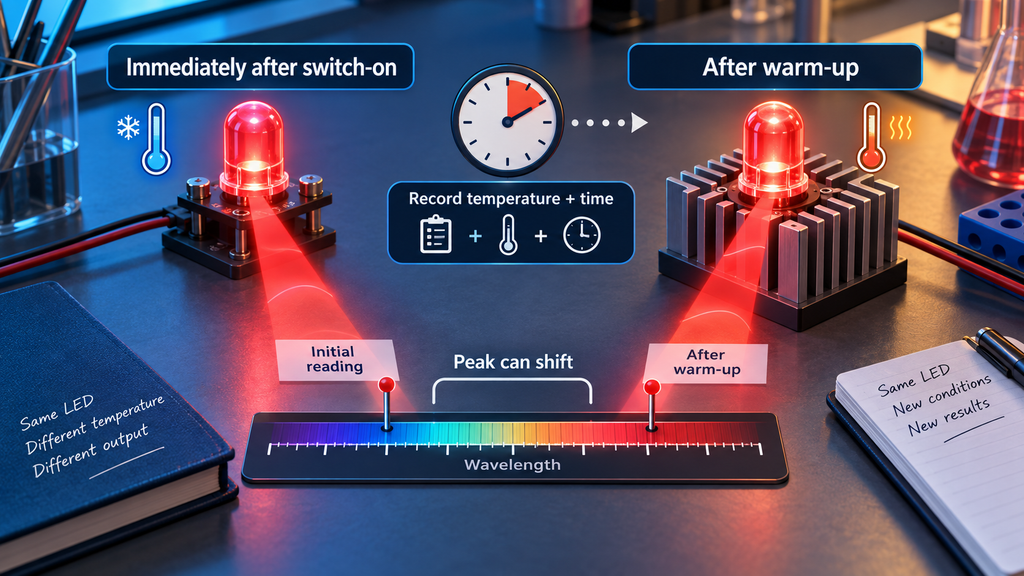
LED peak wavelength and output can change as junction temperature changes. The direction and size depend on the semiconductor and construction. A panel measured immediately after switch-on may not match the same panel after thermal stabilization.
A transparent spectral test should record the warm-up period, ambient conditions, output setting, and measurement time. It should also avoid implying that a single measured unit defines every unit ever produced. Manufacturing tolerances create device-to-device variation.
Thermal management matters for repeatability. Cooling fans and heat sinks are not merely comfort features; they help the electronics and emitters operate under more stable conditions.
Bin Tolerances and Manufacturing Variation
LED manufacturers sort components into bins based on properties such as output, color, voltage, and wavelength. A device company may purchase a nominal wavelength bin that permits a range around the label. The finished product’s measured peaks can therefore vary between production runs.
When exact spectral output matters, ask for tolerances rather than only the target. A specification like “660 nm ± 5 nm peak” provides more information than “medical-grade 660 nm.” The latter phrase does not define a spectral tolerance.
Independent measurements should report the specific unit and serial or production batch when available. Results can support a model assessment without proving that every unit is identical.
Multi-Wavelength Panels Create Multiple Peaks
A panel advertised with 630, 660, 810, 830, and 850 nm LEDs should show multiple spectral features when all channels are active. Each LED type has its own peak and width. Depending on relative power and spacing, some peaks may appear taller than others.
FWHM becomes harder to summarize when neighboring bands overlap. One overall width across the combined spectrum can be misleading. The report should identify each peak, its approximate FWHM, and preferably the integrated power associated with each band.
A normalized graph can exaggerate a weak wavelength if every channel is normalized separately. A combined absolute spectral irradiance graph is needed to show relative contribution at the measurement plane.
How a Spectrometer Measures the Spectrum
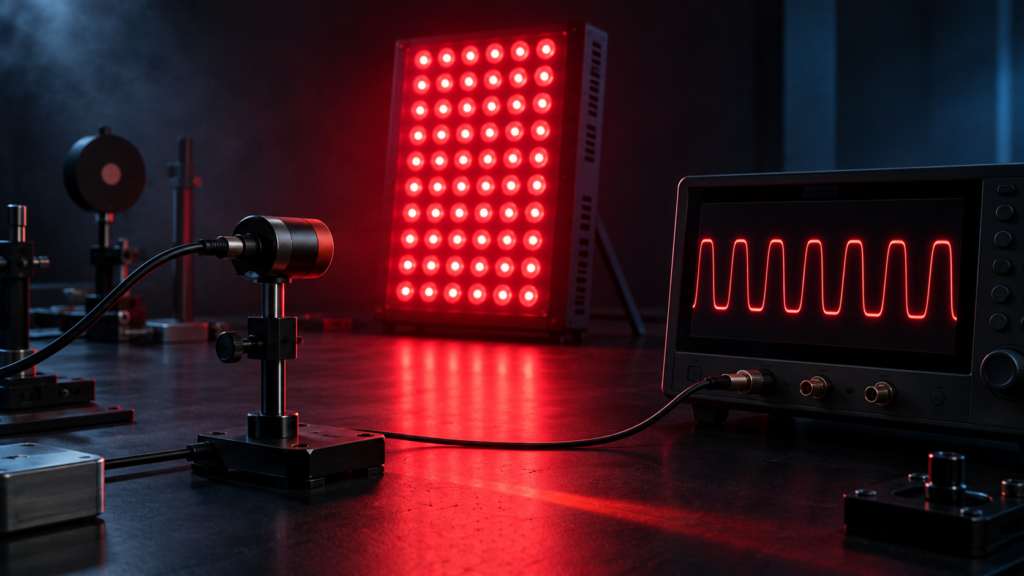
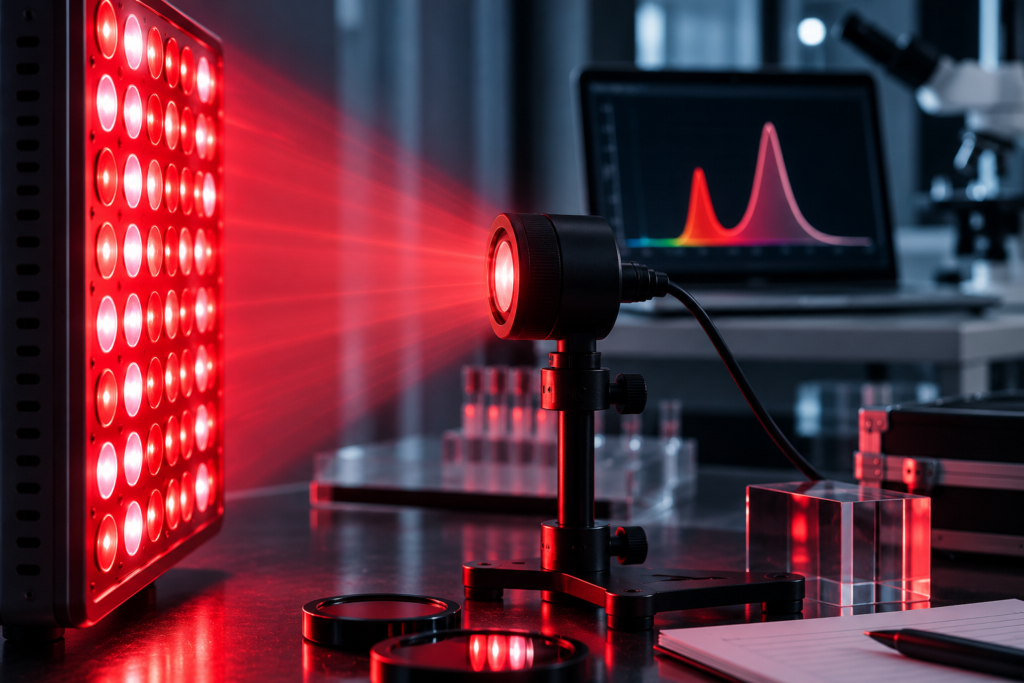
A spectrometer separates incoming light by wavelength and measures detector response across the range. Instrument resolution, slit width, optical geometry, calibration, stray light, detector sensitivity, and saturation affect the result.
If the instrument resolution is coarse relative to the LED peak, the measured FWHM can be broadened. If the detector saturates, the top of the peak can flatten and distort the half-maximum points. A dark correction and wavelength calibration help reduce error.
The sensor must be suitable for both visible red and near-infrared wavelengths. Some inexpensive instruments end before 850 or 1060 nm, while others have weak response near the edge of their range. A report should state the model, calibration, wavelength range, and resolution.
How to Read a Red Light Therapy Spectrum Report
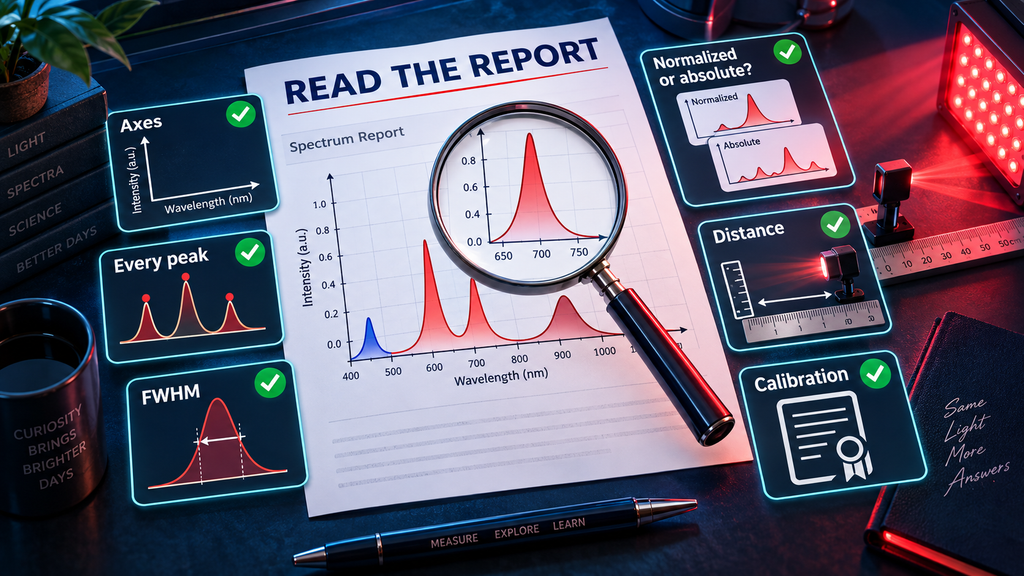
- Check the axes. The horizontal axis should be wavelength in nanometers. The vertical axis should identify relative intensity, spectral power, or spectral irradiance.
- Identify every peak. Compare measured peaks with the advertised wavelengths.
- Look for FWHM values. Confirm whether they were calculated for individual peaks.
- Check absolute versus normalized data. A normalized chart shows shape, not delivered power.
- Review channel settings. Determine whether all wavelengths were on and whether channels were also measured separately.
- Check distance and geometry. Spectral irradiance at a treatment plane depends on measurement position.
- Look for calibration details. Wavelength accuracy and radiometric calibration are separate issues.
- Note warm-up and output level. Dimming and temperature may alter results.
Common Misinterpretations
“660 nm” means every photon is 660 nm
That is not how a typical LED spectrum behaves. The label usually identifies a nominal or peak region.
FWHM gives the complete emission range
Output extends beyond the half-maximum crossings. FWHM summarizes the main peak width.
A narrower spectrum automatically penetrates deeper
Penetration depends primarily on wavelength-specific tissue interactions and the delivery geometry, not on narrowness alone. A narrow 660 nm source does not automatically reach deeper than a somewhat broader source centered at 810 nm.
A spectrometer graph proves therapeutic effectiveness
It verifies spectral properties under the test conditions. It does not establish a health outcome.
The tallest normalized peak carries the most absolute power
Separate normalization can make every wavelength look equally strong. Absolute calibrated data are needed for power comparison.
FWHM Versus Wavelength Accuracy
Wavelength accuracy asks whether the measured peak is near the advertised value. Spectral width asks how broad the emission is. These are independent qualities. An LED can peak accurately at 660 nm with a wide band, or peak at 653 nm with a narrow band.
A useful specification reports both the peak tolerance and typical FWHM. For multi-wavelength devices, the information should be provided for each LED type. Our wavelength guide covers the broader differences between visible red and near-infrared bands.
What Consumers Should Ask Manufacturers
- Are the listed wavelengths nominal targets or measured peaks?
- What peak tolerance applies to each LED type?
- What is the typical FWHM for each band?
- Was the finished panel measured or only the component datasheet cited?
- Can the company provide a calibrated spectrum with instrument details?
- Were channels measured separately and together?
- Does the graph show relative intensity or absolute spectral irradiance?
- At what output setting, distance, and warm-up time was it measured?
How Spectral Width Fits Into Device Selection
Spectral reporting is a transparency signal, not a standalone buying score. A well-documented panel can still be unsuitable for a user’s coverage, controls, space, budget, or intended goal. Compare wavelength data alongside irradiance, uniformity, recommended distance, flicker, construction, warranty, and safety documentation.
The red light therapy device buyer’s guide provides that wider framework. Avoid choosing solely because one brand advertises more wavelengths or a narrower FWHM.
Why the Original Spectrum File Is Better Than a Screenshot
A useful spectrum report also preserves the instrument’s exported data rather than only a cropped marketing image. Numeric wavelength and intensity values allow another analyst to check the peak, calculate FWHM consistently, identify smaller secondary features, and compare output before and after warm-up. Screenshots can hide axis scaling, smoothing, normalization, or clipped tails. Sharing the raw or tabulated spectrum with calibration and test conditions makes the result substantially more reproducible.
Conclusion
A 660 nm LED is normally a band of red wavelengths clustered around a nominal or measured peak. FWHM describes the distance between the two wavelengths where the spectral curve falls to half of its maximum. It is a compact description of width, not the complete spectrum and not a measure of delivered dose.
Look for peak wavelength, tolerance, FWHM, full spectral power distribution, measurement conditions, and instrument details. For multi-wavelength panels, each peak should be characterized separately and in the combined output. Accurate spectral reporting makes device claims and research protocols easier to reproduce, but it should never be presented as proof of a biological result.